It is already on the road
Lane keeping assist is on 86.3% of model-year-2023 vehicles, and continuous lane centering on 53.9% (PARTS, 2024). Drivers lean on it every day, whether or not the road was designed for it.

How lane keeping assist really performs on public roads
Lane keeping assist (LKA) is the feature that steers a car to stay centered in its lane. It ships on most new vehicles, and it works only as well as the road lets it. OpenLKA is the largest open record of how production LKA systems behave in real traffic: 389 hours of driving from 62 vehicle models, most of it recorded on Tampa Bay highways and rural roads.
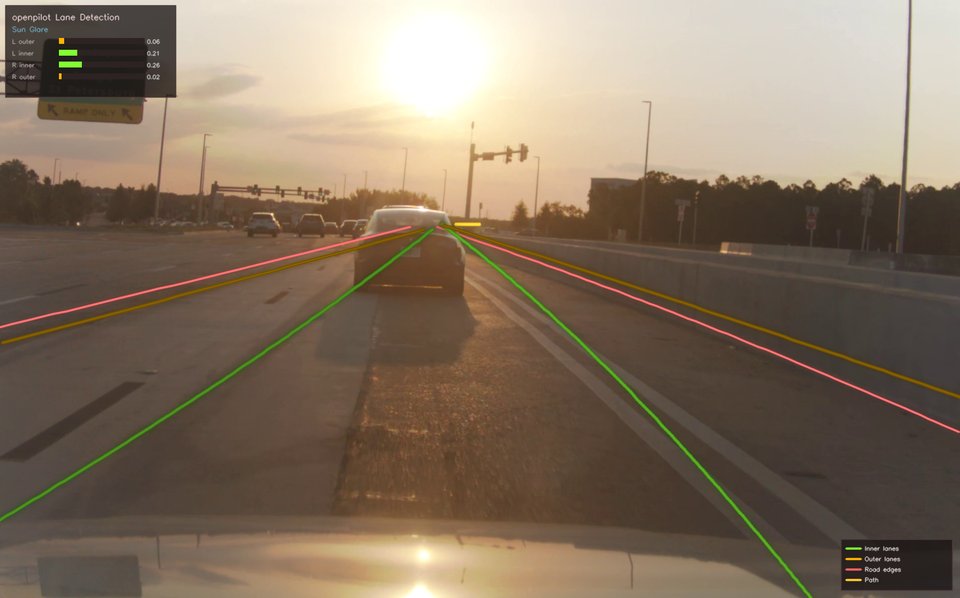
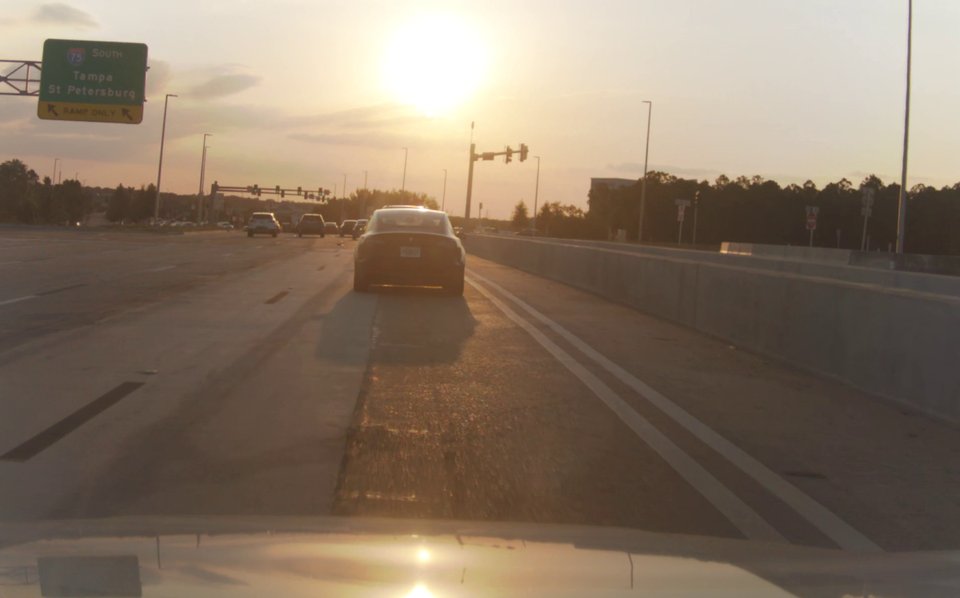 CameraLane detector
322 unique route logs · 30+ states and provinces · 83% recorded in Tampa Bay · decoded vehicle signals, synchronized video and scene labels · MIT license
Lane keeping assist reads painted lines with a camera. The road is half of the system.
Lane keeping assist is on 86.3% of model-year-2023 vehicles, and continuous lane centering on 53.9% (PARTS, 2024). Drivers lean on it every day, whether or not the road was designed for it.
Faded paint, white lines on pale concrete, glare, rain and tight curves all change what the car does. In our sample, four of the five most common conditions behind large drifts were about seeing the line.
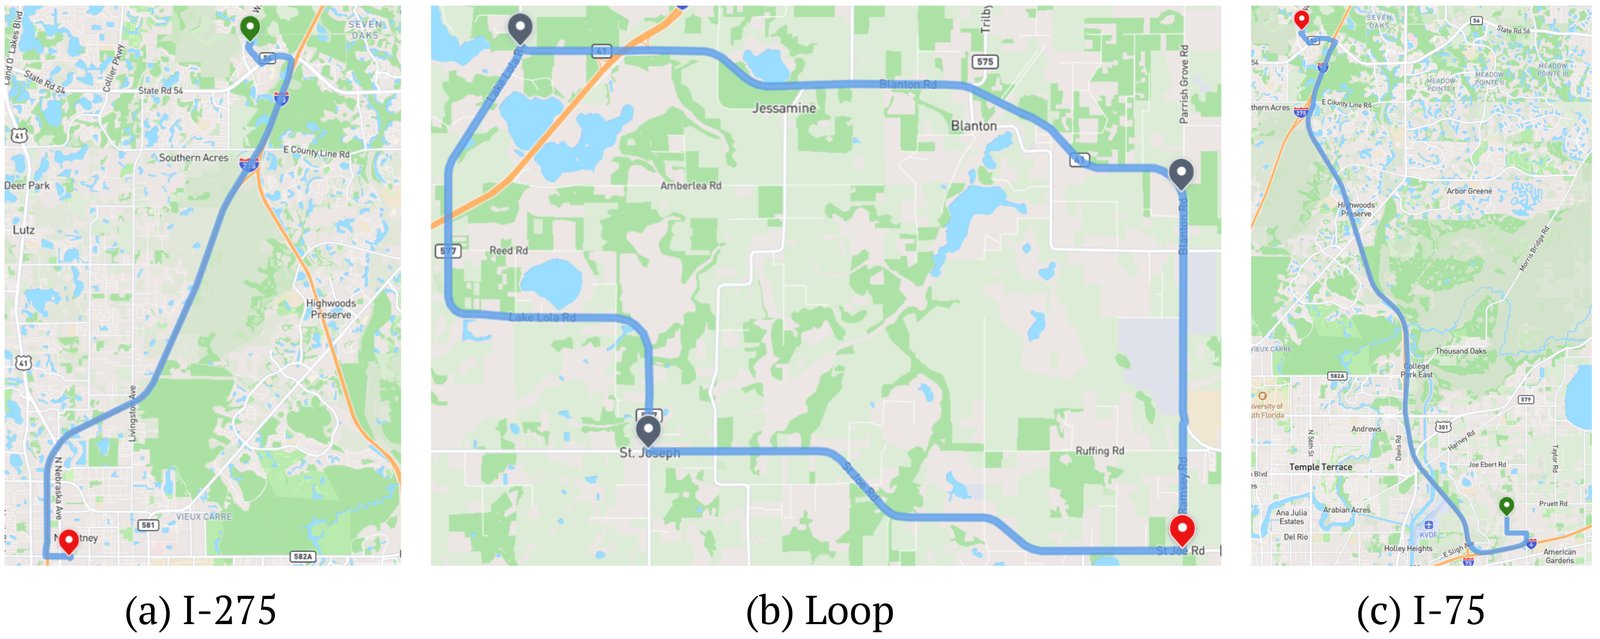
Four lab drivers logged 323 hours on I-275, I-75 and rural two-lane roads from late 2023 through 2025, including the 2024 hurricane season. Community drivers added 66 hours from 30+ states and provinces.
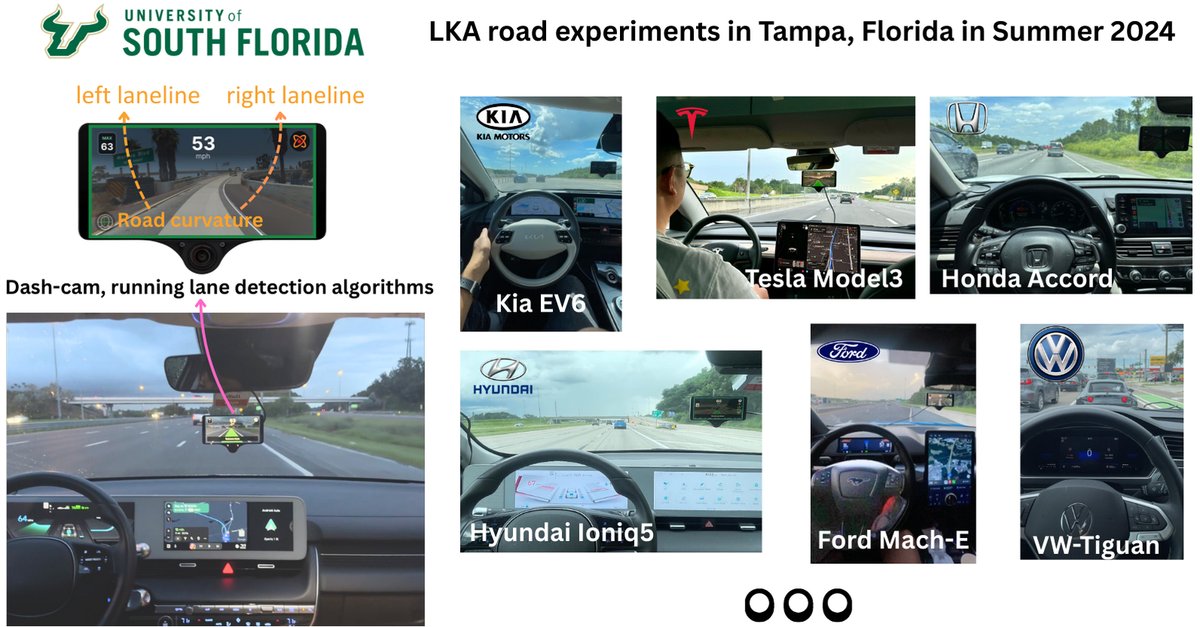
Why it matters for your DoT. The same recorder and method can audit any corridor, in Florida or elsewhere, for how production lane keeping behaves there, before and after a marking or paving project.
The same Tampa roads were driven again and again in different weather and light. Community drivers added snow, mountains and city traffic.
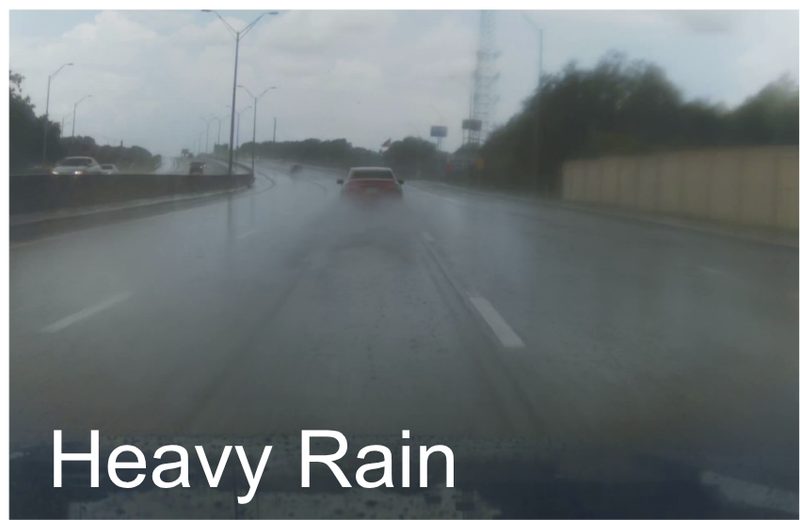
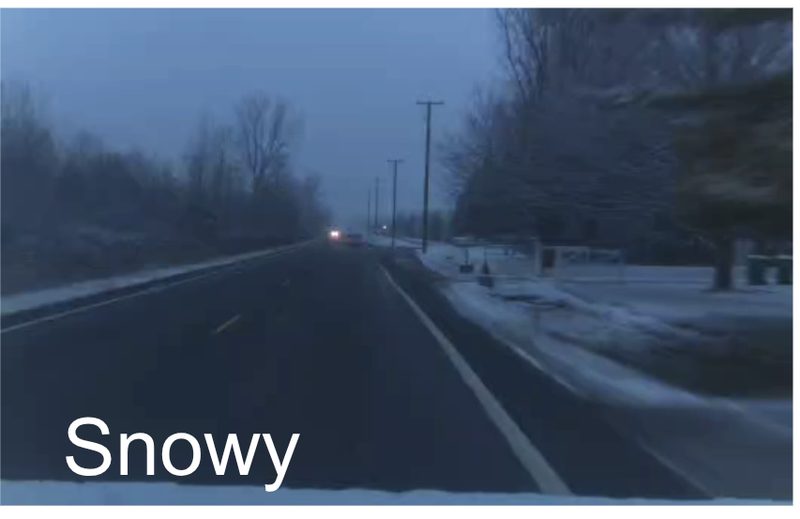
Spray hides both lane lines. In our recordings LKA often disengaged in heavy rain, which means the driver gets the car back with no warning. Florida's afternoon storms make this a routine event, not an edge case.
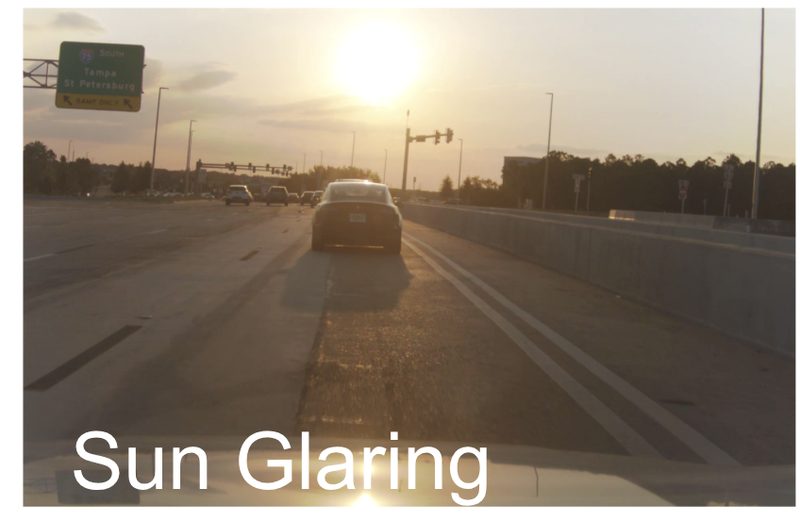
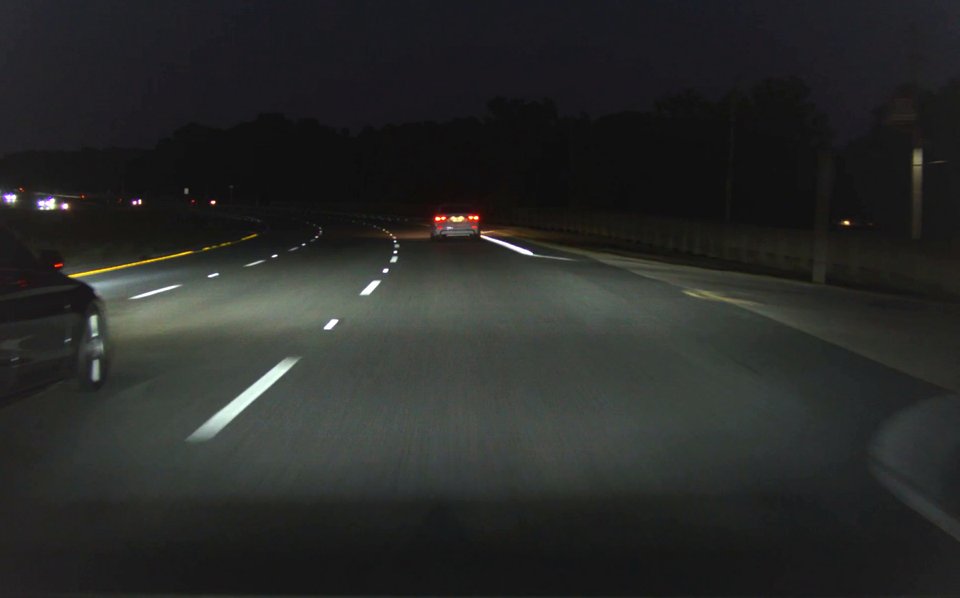
Low sun washes out the paint, and at night only the headlight-lit stretch of line is visible. Low light was tagged in 12.1% of the samples with a large lane deviation, and glare in 5.5%.
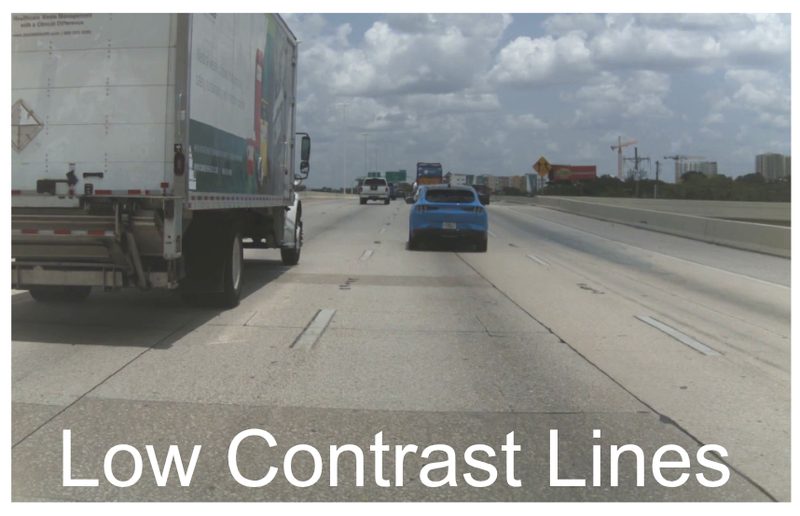
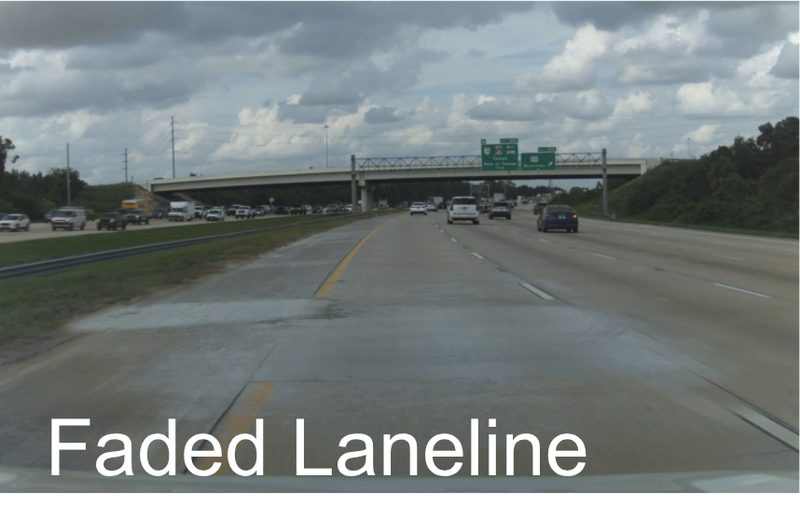
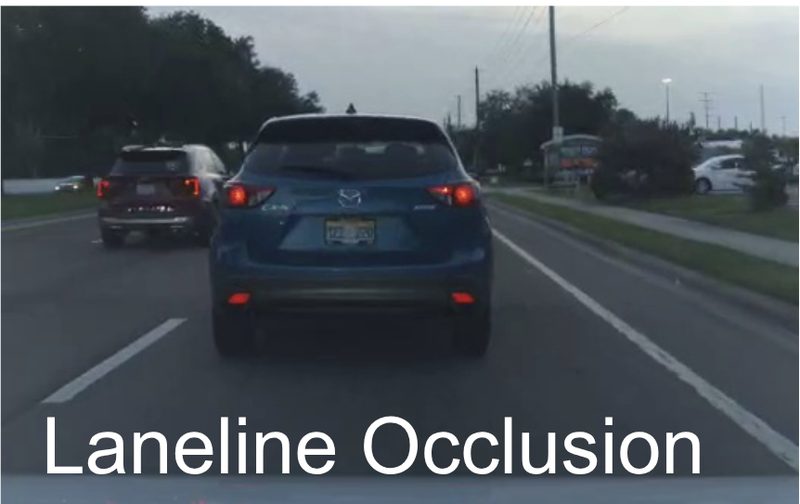
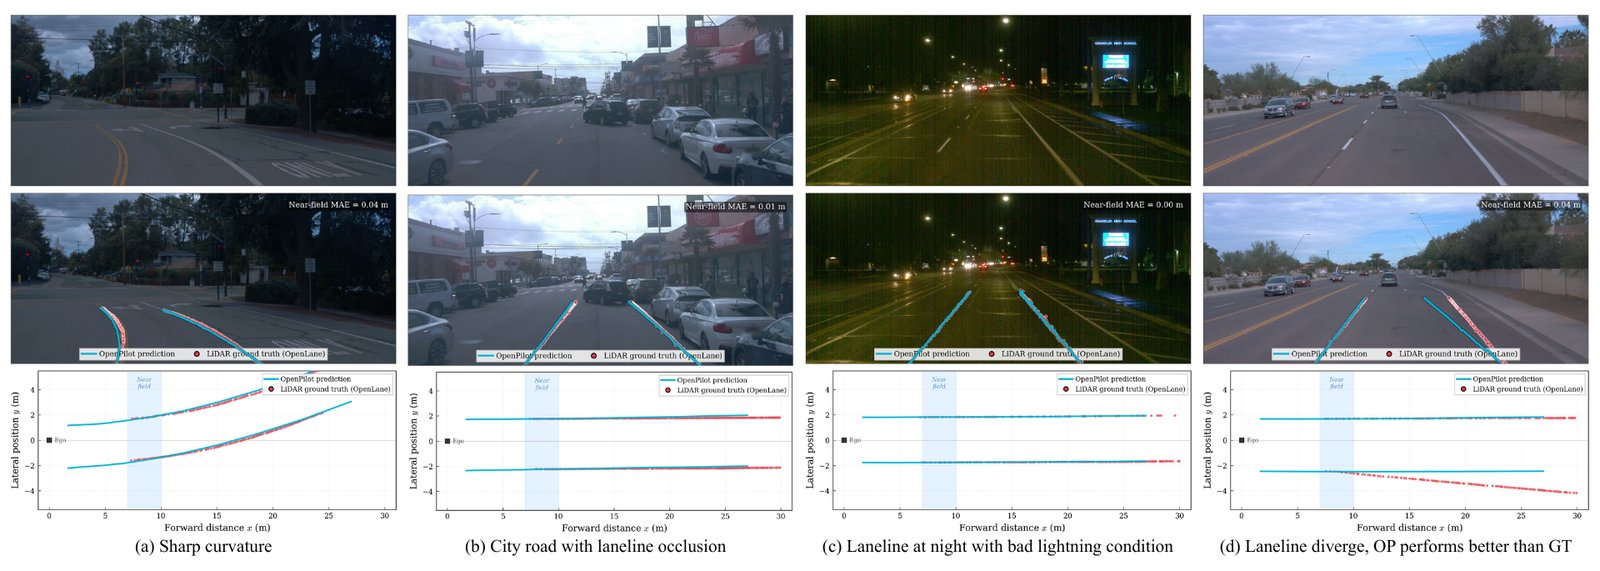
Occlusion (19.7%), low contrast (14.6%) and faded markings (11.5%) were the three most common conditions behind large drifts. White lines on white concrete are the hardest case: the camera sees almost no contrast. This is the lever a road owner controls most directly.
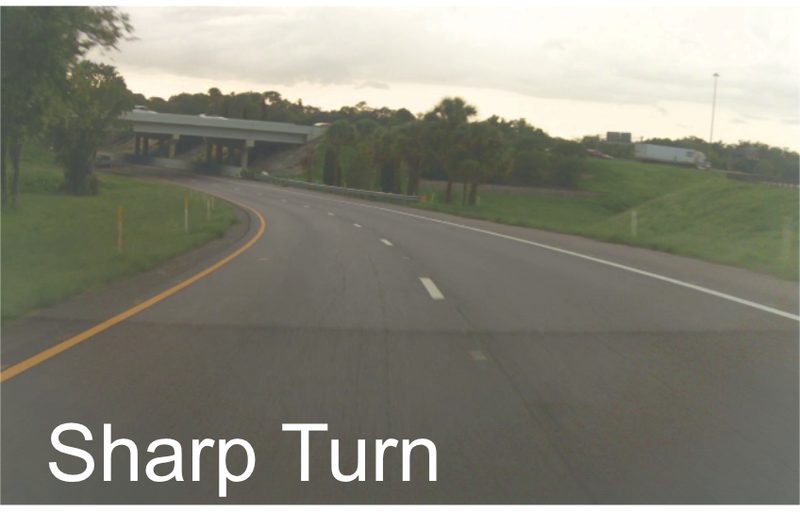
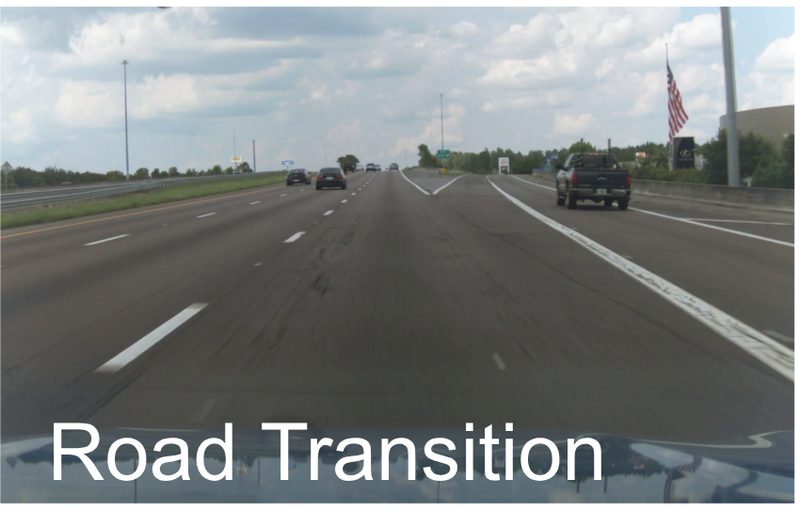
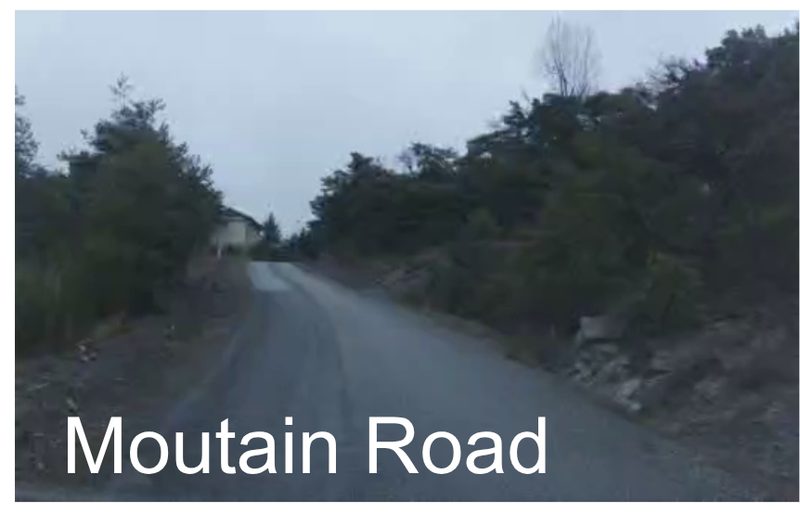
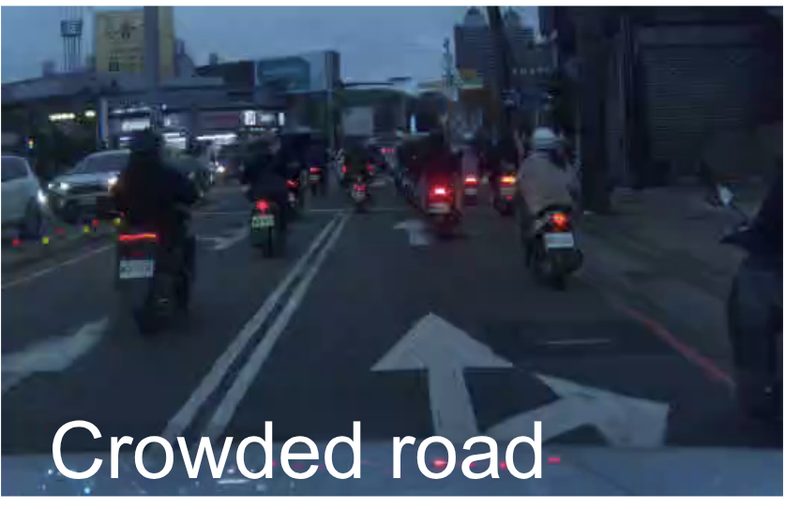
Tight curves and lane transitions at merges and diverges confuse both the camera and the steering. On one sharp rural curve the car drifted 1.2 m (3.9 ft) toward the outside even though both lines were detected the whole time.
Why it matters for your DoT. Every one of these conditions exists on a state highway system today. The dataset lets an engineer see how a production car reacts to each one, without a test track.
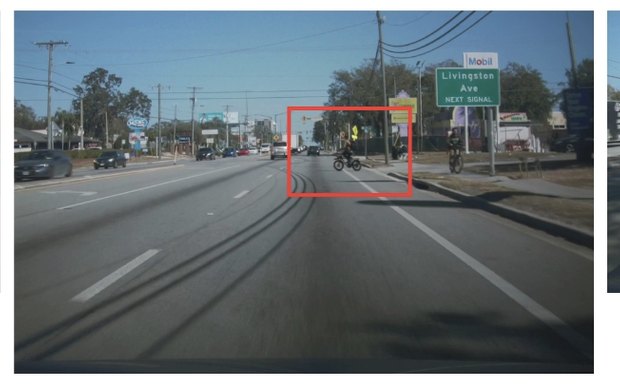
Pick a road condition, then drag the handle. Left is the camera frame, right is what the lane model found.
CameraLane detector
The lane model is the open-source openpilot lane detector, used here only as a camera-based measuring tool. Its lane-position estimate was checked against LiDAR ground truth on the OpenLane benchmark: typical error 0.135 m for lane position and 0.281 m for line distance. The drifts discussed on this page are two to nine times larger than that error.
Ordinary rental cars with factory driver assistance, recorded by the lab's own devices. Click a car to watch a 12-second clip around the moment the driver takes over.
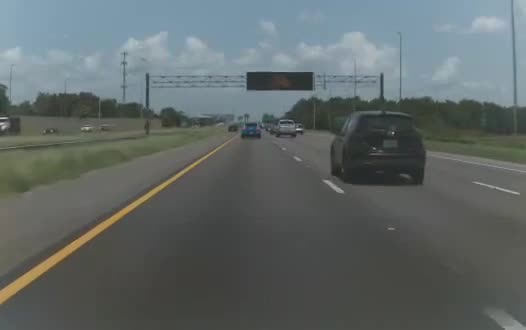 Hyundai Ioniq 589.7 h · two configurations
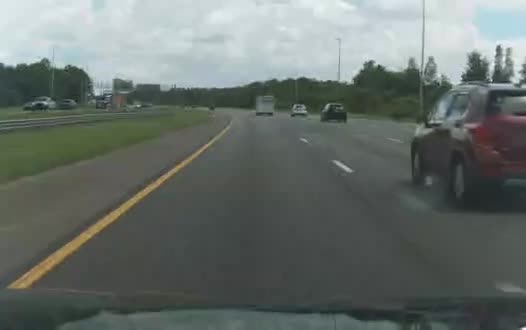 Kia Niro EV48.3 h
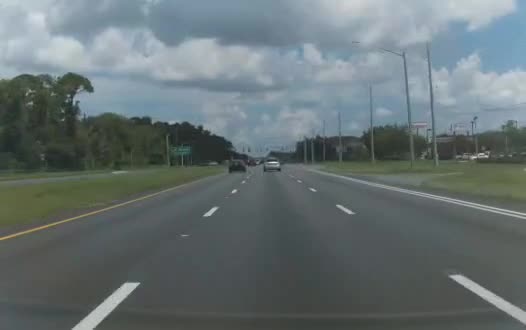 Tesla Model 347.8 h
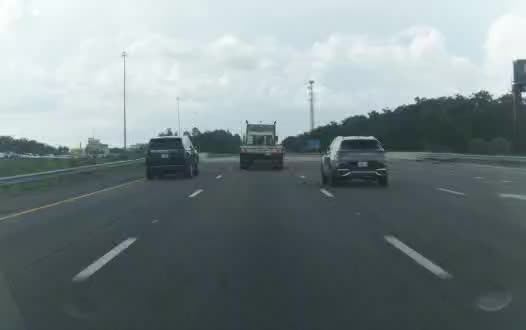 Kia EV651.3 h · two entries
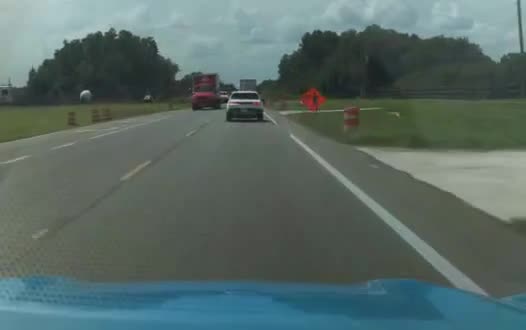 Ford Mustang Mach-E30.3 h · work zone and rain clips
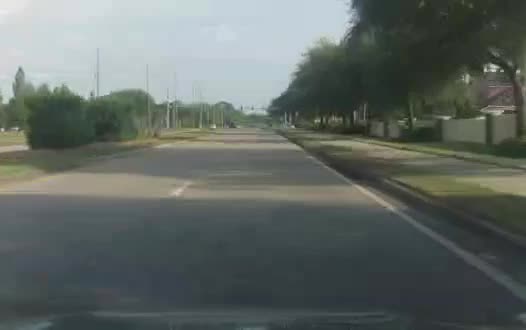 Toyota Camry41.2 h · two configurations
 Honda Accord Hybrid19.0 h
 Tesla Model XTampa test fleet
 Toyota RAV4two configurations
 Volkswagen TiguanTampa test fleet
Clips come from ADAS-TO, the takeover subset of the same recordings, trimmed to 12 seconds with the driver's takeover at the midpoint. The lab's recorder runs openpilot; in most clips its lane centering was engaged before the takeover, and in one Camry clip the vehicle's own system was. Each clip's caption states which. Hours per model are from the dataset paper where published. Source video is 526 × 330 pixels.
Why it matters for your DoT. These are cars people rent and buy today. The dataset shows how each one behaves on the same roads, under the same conditions.
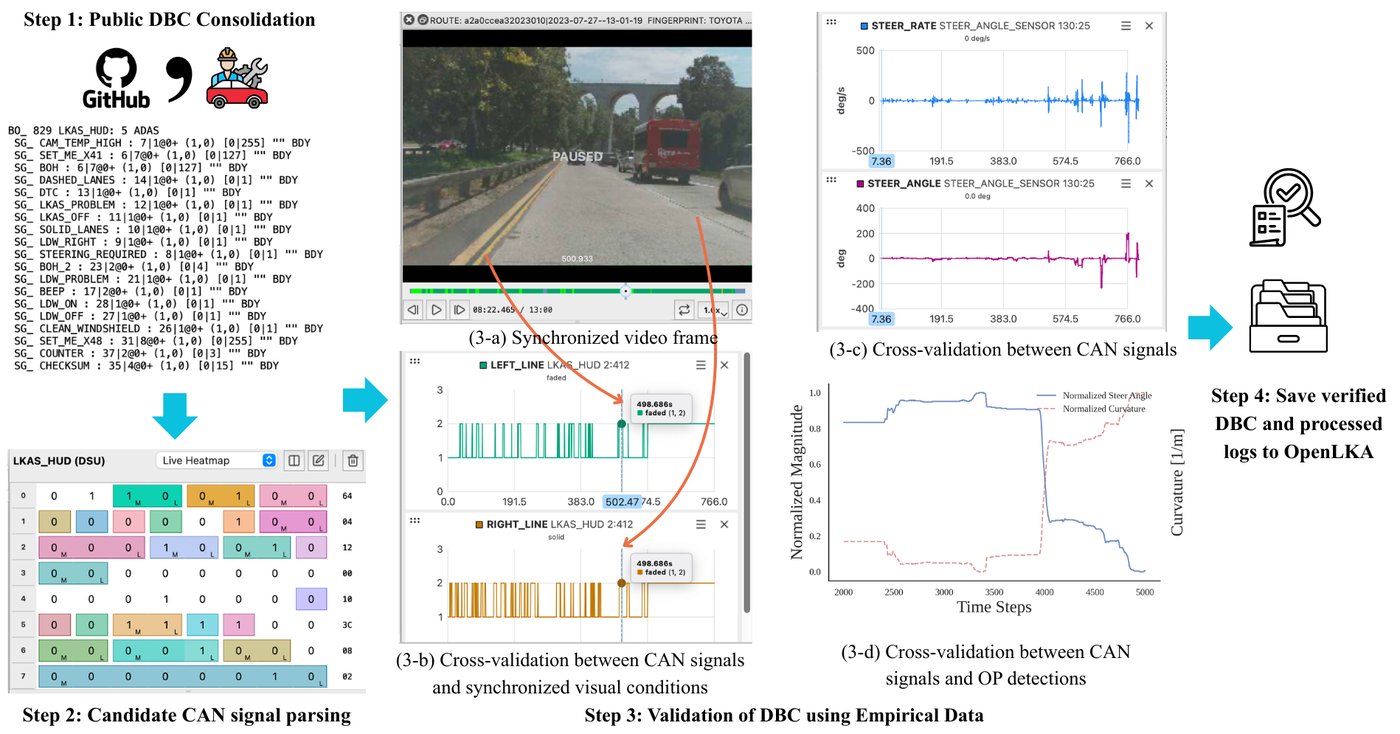
The recorder logs the car's CAN bus and the forward camera together. We turn that log into a 100 Hz table in which every row holds the car's own lane-keeping state, steering and speed next to what the camera-based lane model saw at the same instant.
Pick a drive; each tab names its recorder. The video, the car's own lane-keeping state, steering, the camera lane model and the raw CAN frames all run on one clock. Click anywhere on a chart to seek. A clip is labelled "stock" only when the recorder transmitted no steering frames at all; the one clip where openpilot was steering says so.
| t (s) | bus | address | message | bytes | decoded |
|---|
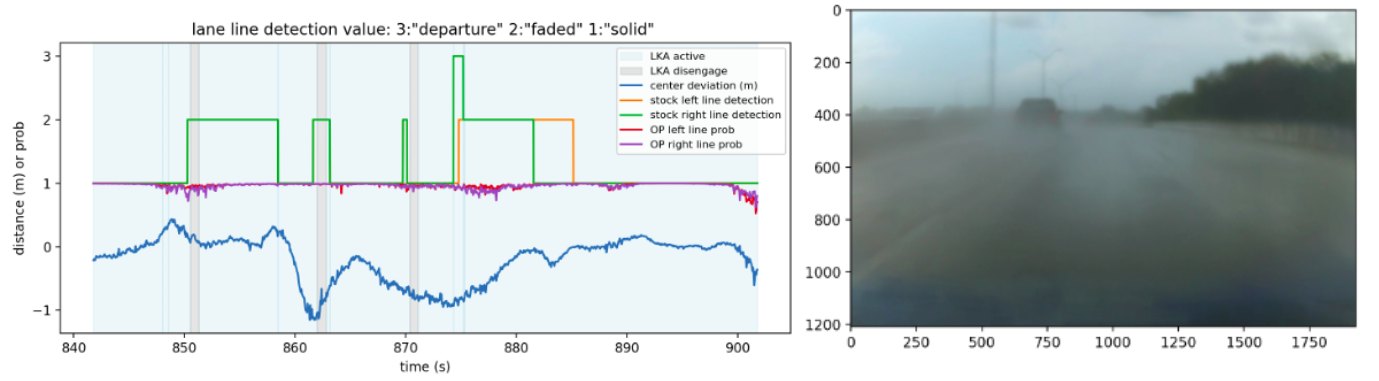
The interactive explorer could not load its data. The figure above shows the same kind of decoded record.
Three of the lab's own comma 3X recorders produced the clips on this page. Each has a fixed ID that appears in every file name; those IDs are the provenance key for every clip and table here.
These three devices hold 180 h, 9,549 km and 358 route logs on the lab server, counted per recording (hours and distance from the route metadata, routes from the dataset directory). The paper's Tampa figures (323 h, 127 unique routes) cover the whole campaign and de-duplicate repeated drives of the same road.
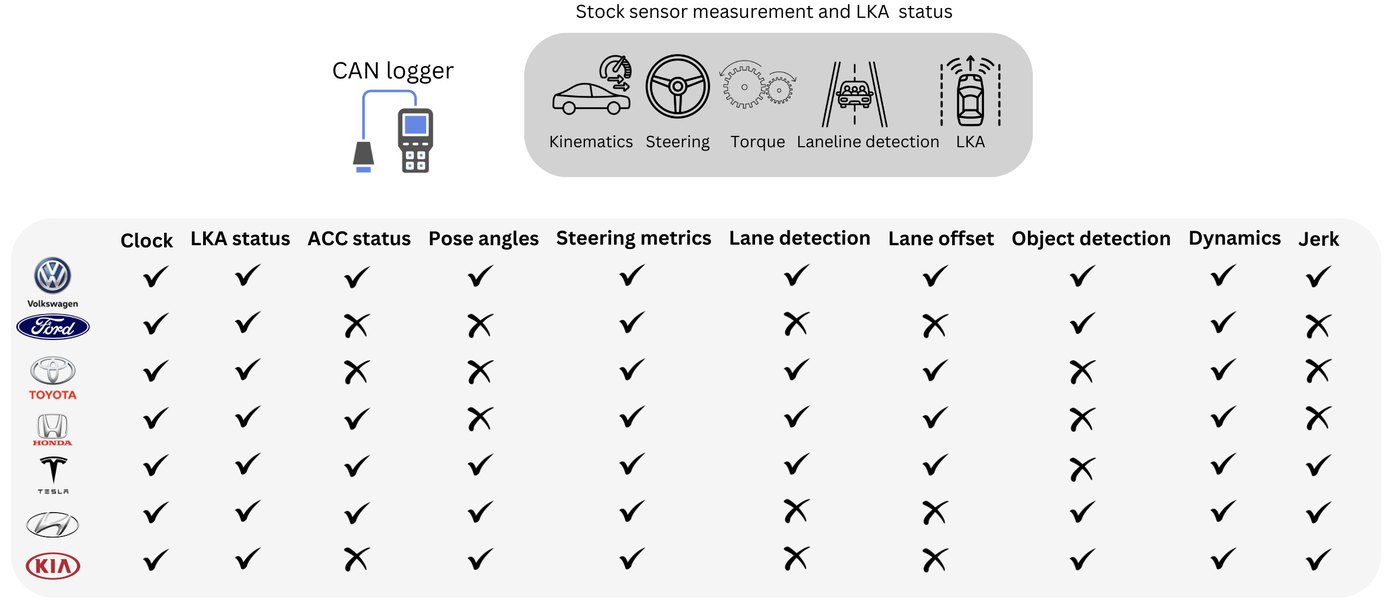
| Make | ||||||||
|---|---|---|---|---|---|---|---|---|
| Volkswagen | ✓ | ✓ | ✓ | ✓ | ✓ | ✓ | ✓ | ✓ |
| Ford | ✓ | ✓ | ✓ | ✗ | ✓ | ✓ | ✓ | ◐ |
| Toyota | ✓ | ✓ | ✓ | ✓ | ✗ | ✓ | ◐ | ✓ |
| Honda | ✓ | ✓ | ✓ | ✓ | ✓ | ✓ | ✓ | ✓ |
| Tesla | ◐ | ✓ | ◐ | ◐ | ✓ | ✓ | ✓ | ◐ |
| Kia | ✓ | ✓ | ✓ | ✗ | ✓ | ✓ | ✗ | ✓ |
| Hyundai | ✓ | ✓ | ✓ | ✗ | ✓ | ✓ | ✗ | ✓ |
✓ broadcast on the bus and decoded ◐ recovered through DBC integration and validation ✗ not available. Source: the journal revision's signal-availability table. "Steer angle & torque" means at least one steering signal is available; pedals are normalized percentages. Hyundai's camera ECU (0x2A4) also broadcasts a 0–3 line-detection level per side on the Ioniq 5 and Niro, decoded after that table was drawn.
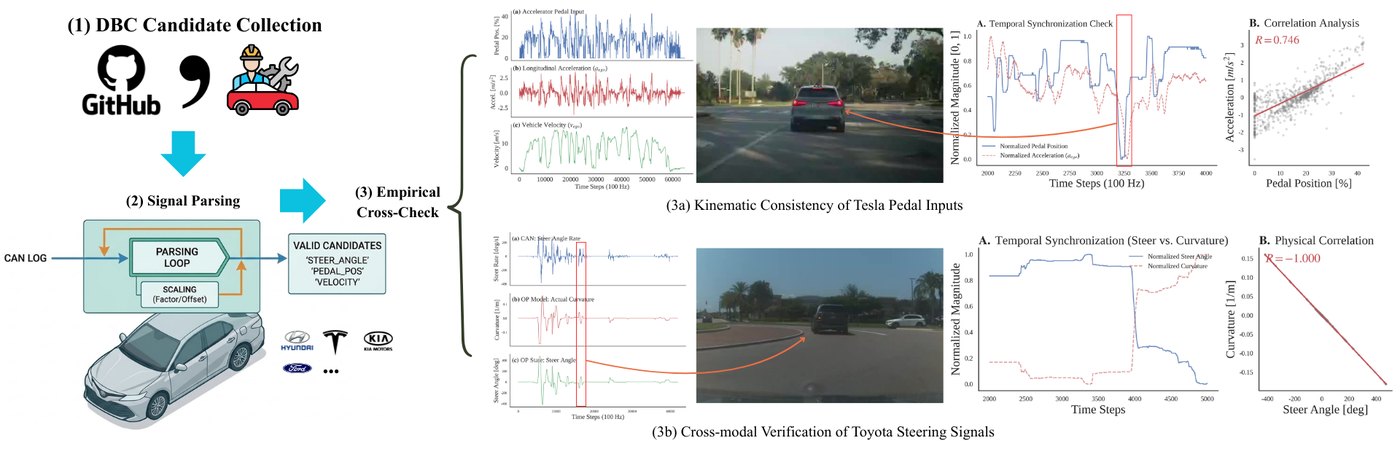
hyundai_canfd.dbc
final_toyota_canfd.dbc
ford_canfd.dbc
tesla-model-3.dbc
final_cleaned_extended_honda_accord_acc_lka.dbc · honda_civic_ex_2022_can.dbc
vw_mqb_2010.dbc
Why it matters for your DoT. An engineer can read the car's own lane-keeping state on a corridor, second by second, with no instrumentation beyond a windshield recorder, and compare it with what the road looked like at that instant.
On good roads the systems are steadier than people. When the line is hard to see, drifts get large.
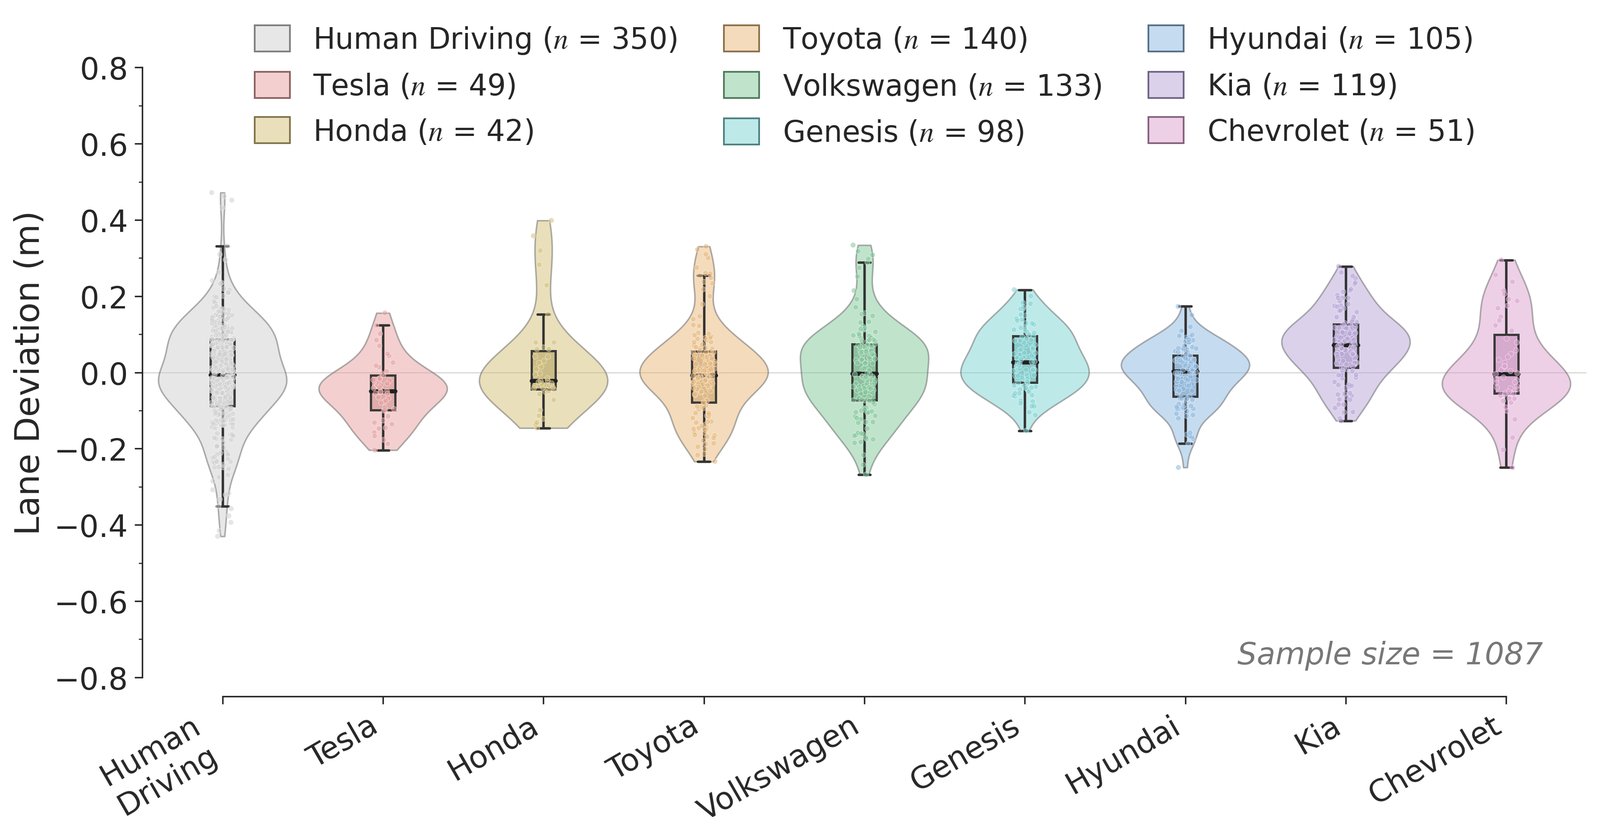
Spread of lane position under normal conditions, LKA versus human drivers. The systems are about 24% steadier when the road is clear.
Typical worst drift on a route (the 95th-percentile deviation, median across routes: 0.32 m left, 0.28 m right).
Some drifts exceed 0.8 m (2.6 ft), seen across automakers. That puts a tire on the line.
Sideways drift rates above 0.2 m/s are common. At that rate a car uses up half its lane margin in about two seconds.
Share of large-deviation samples tagged with each condition. A sample can carry more than one tag.
Seeing the line Road geometry Other
Under the four line-visibility conditions, the typical worst drift per route rises above 0.5 m (median 95th percentile 0.52 to 0.56 m).
A 12-foot lane and a typical car, seen from above. Markers show the drifts measured in the dataset.
0.25 m noticeable 0.5 m typical worst drift under poor markings 0.65 m critical 0.88 m tire on the line 1.2 m sharp-curve case
About 0.9 m (3 ft) separates a centered car from the line. Under poor markings the typical worst drift uses more than half of it. The worst cases in the dataset put a tire on the line.
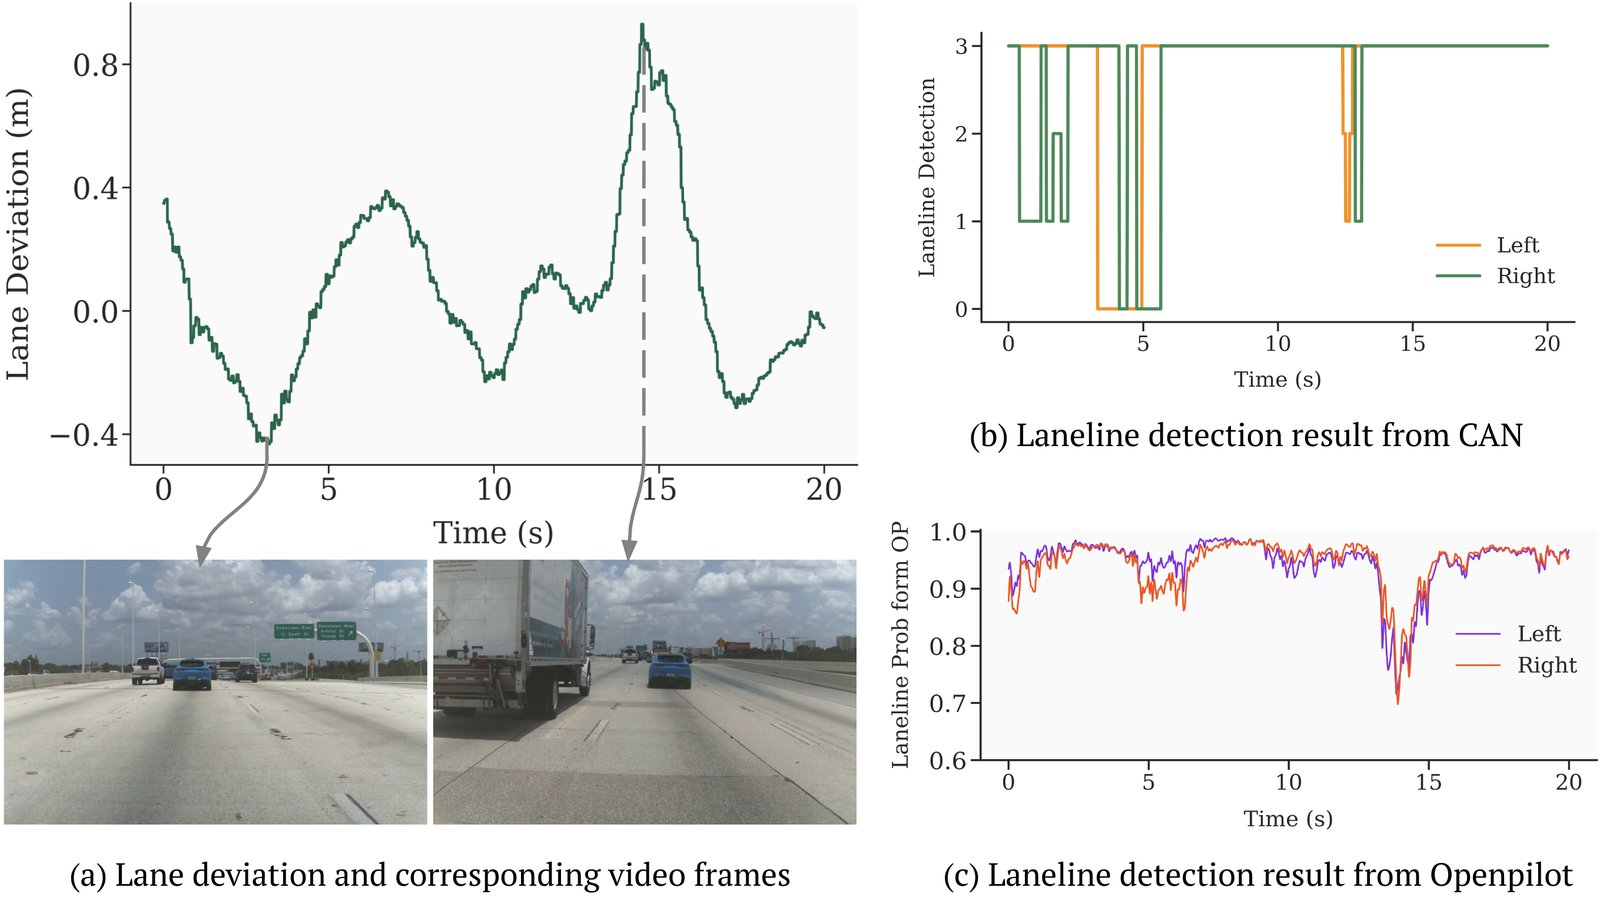
With a truck alongside, the detector's confidence dropped and the car drifted about 0.8 m (2.6 ft) toward the truck.
Road lever: contrast between paint and pavement.
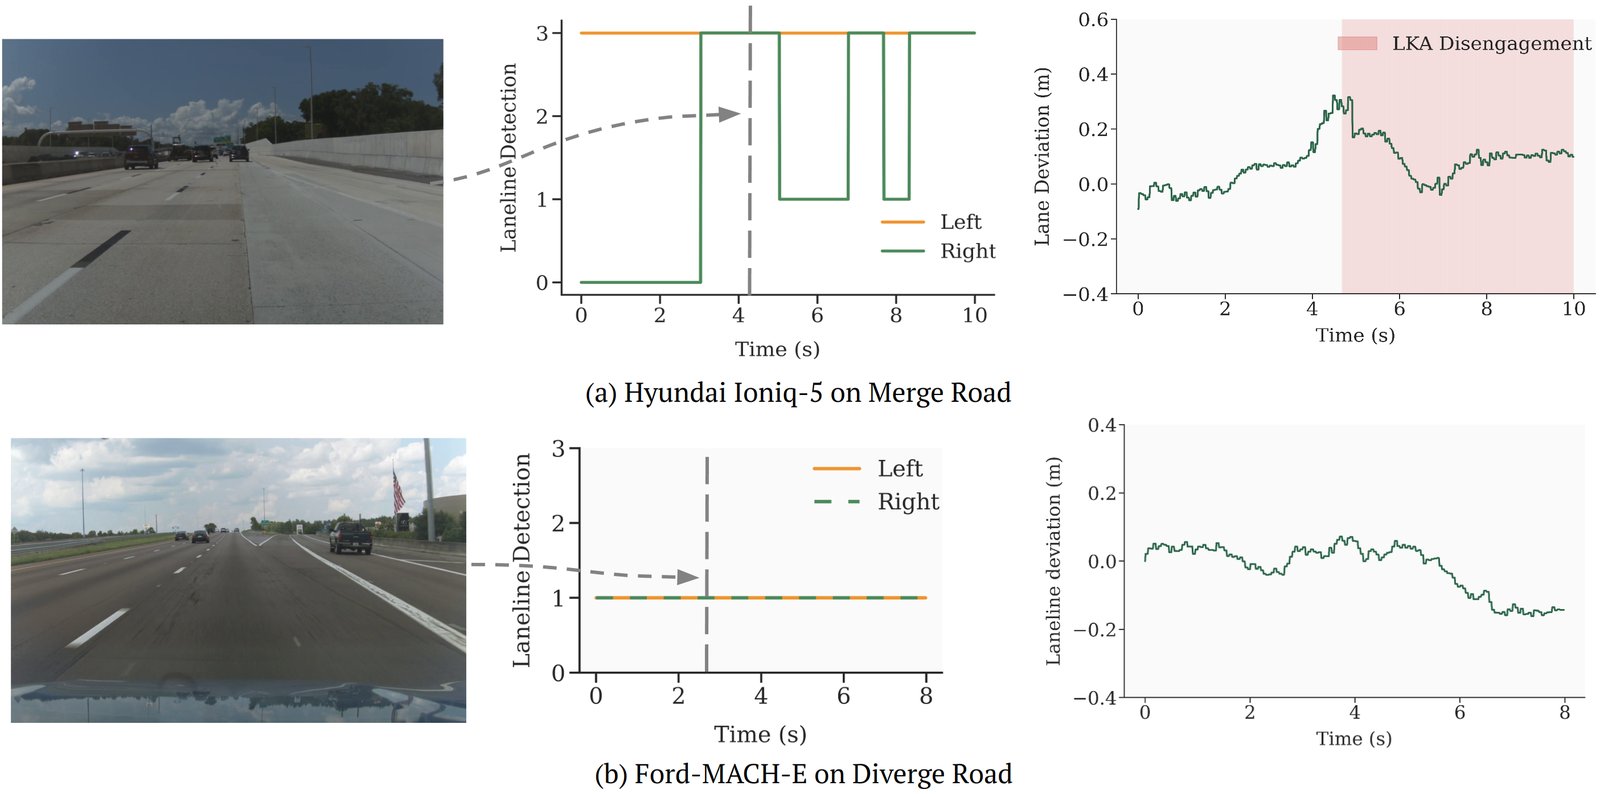
One Ioniq 5 lost the right line at a merge, drifted and switched itself off. A Mustang Mach-E held the lane at a diverge. One event each, not a ranking of brands.
Road lever: continuous, unambiguous markings through merges and diverges.
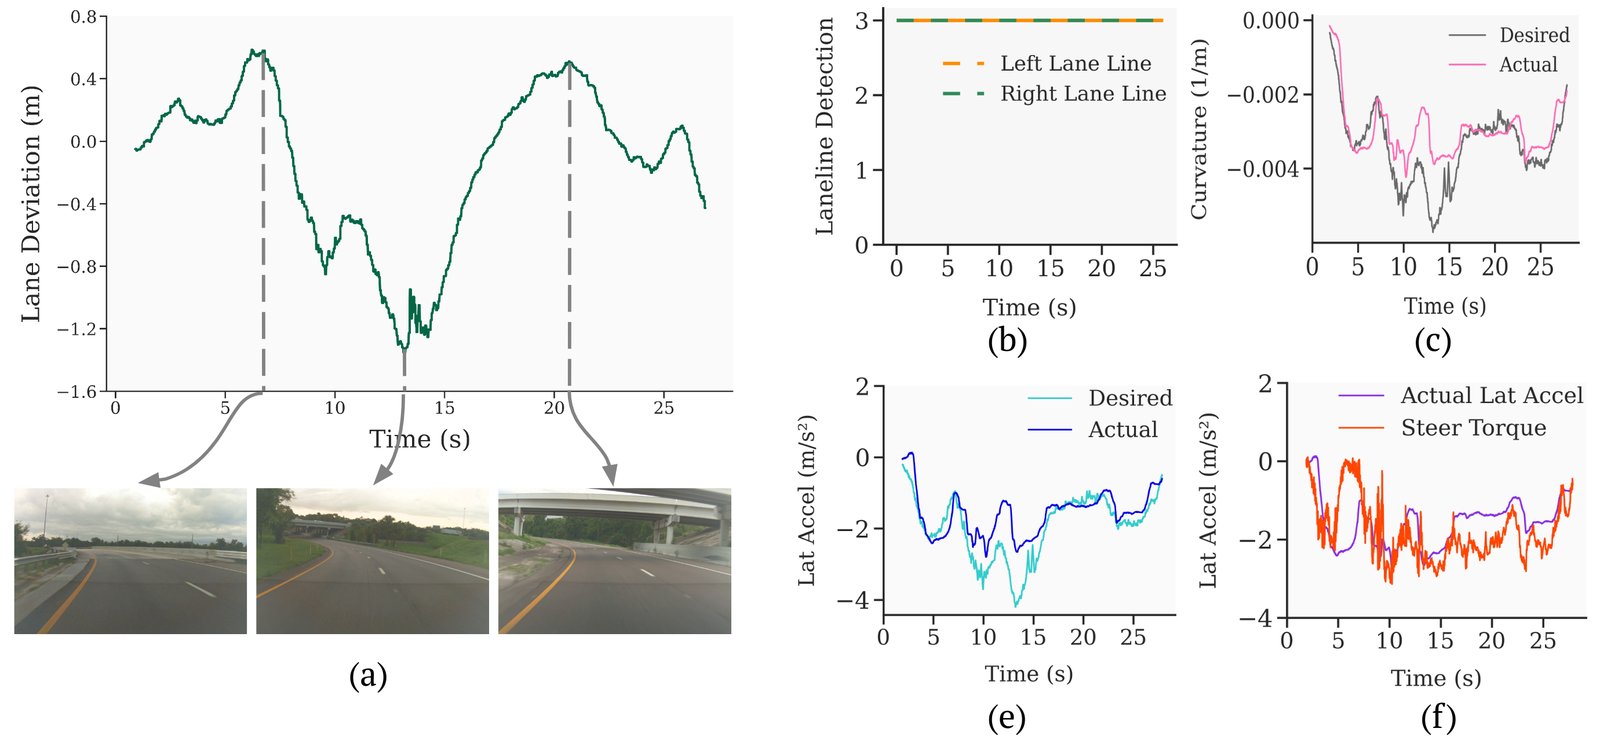
On a sharp two-lane curve the car drifted 1.2 m (3.9 ft) toward the outside while both lines stayed detected. The system's lateral authority ran out before the curve did.
Road lever: curve signing, advisory speeds and geometry that production systems can follow.
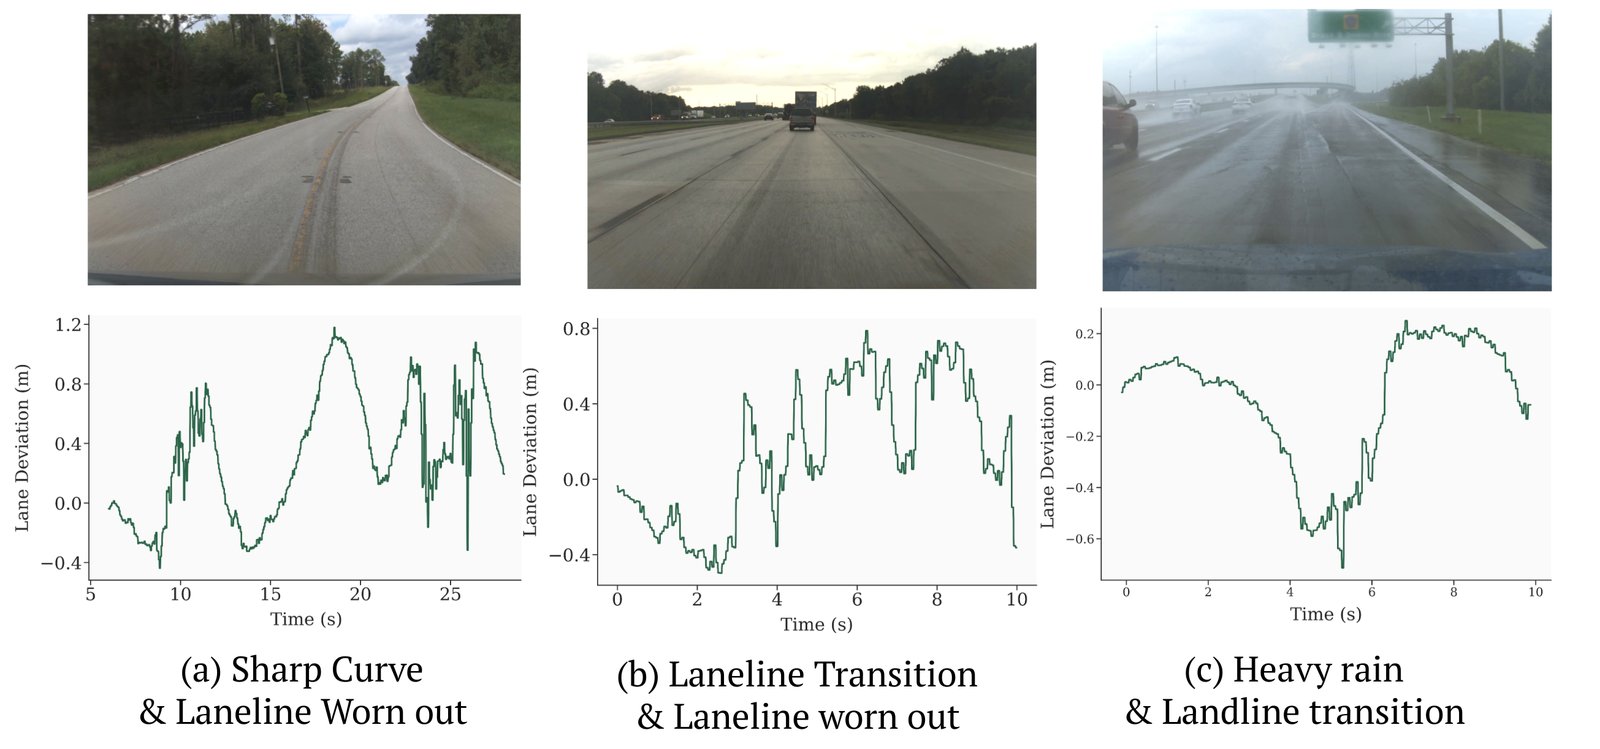
Worn paint on a curve, worn paint at a transition, rain at a transition: three drives, drifts of about 1.2, 0.8 and 0.7 m. Two ordinary problems in the same place behave like one big one.
Road lever: fix markings first where geometry is already demanding.
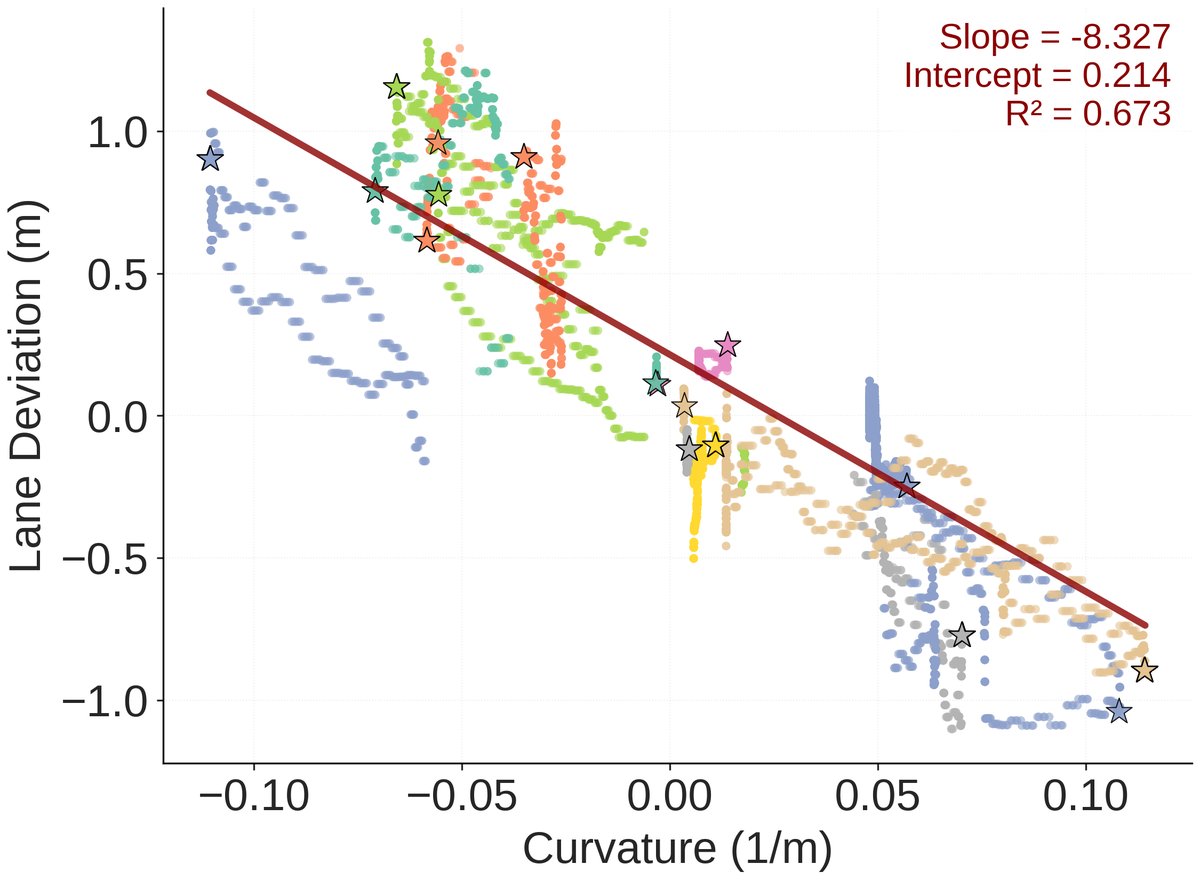
Why it matters for your DoT. Three of the four failure patterns have a road-side lever. The dataset tells you which lever applies on which kind of road.
Three levers an agency controls, each tied to what we measured. These are associations observed in our sample, not controlled experiments.
White paint on light concrete and faded yellow lines were behind the lowest detector confidence and some of the largest drifts in our sample. Contrast is the cheapest lever, and it helps human drivers too.
See the low-contrast frameWhere lines split, the car has to pick a line. Continuous edge lines and early lane assignment through transitions give the camera one clear answer.
See the merge caseA dash-cam-sized recorder plus decoded vehicle signals shows how production lane keeping behaves on a specific road section. Run it before a project and again after, on any corridor.
See the methodWhy it matters for your DoT. Lane keeping is becoming standard equipment. Roads that production systems can read are a maintenance target you can set and check.
Large enough to compare automakers, dense enough on one region's roads (Tampa Bay) to study them corridor by corridor.
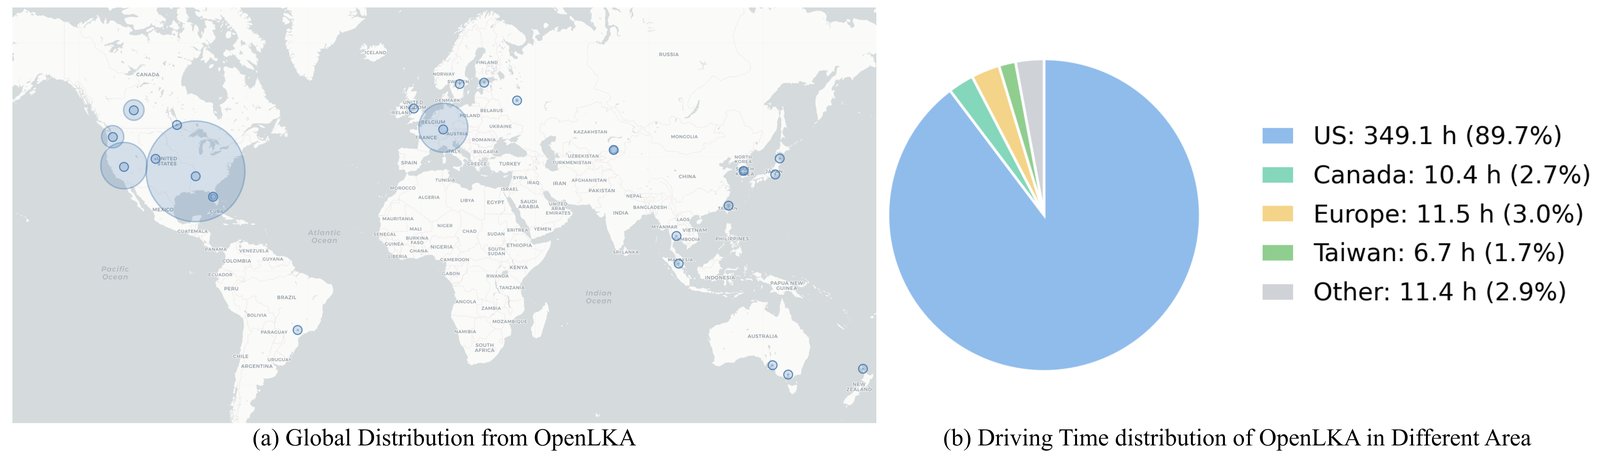
United States 349.1 h (89.7%) Europe 11.5 h Canada 10.4 h Taiwan 6.7 h Other 11.4 h
Tampa lab tests 323.0 h, 4 drivers, 127 routes Community 66.1 h, 49 drivers, 195 routes
| Video | Forward camera at 526 × 330 for every drive; 1928 × 1208 HD and a wide fisheye view for the lab's own drives. Faces and plates blurred. |
|---|---|
| Vehicle signals | CAN bus logs at 10 and 100 Hz, decoded: lane keeping and cruise status, steering angle and torque, speed, acceleration, pedals. |
| Lane geometry | Left and right line distance, road edge and curvature from the on-device lane model, checked against LiDAR ground truth. |
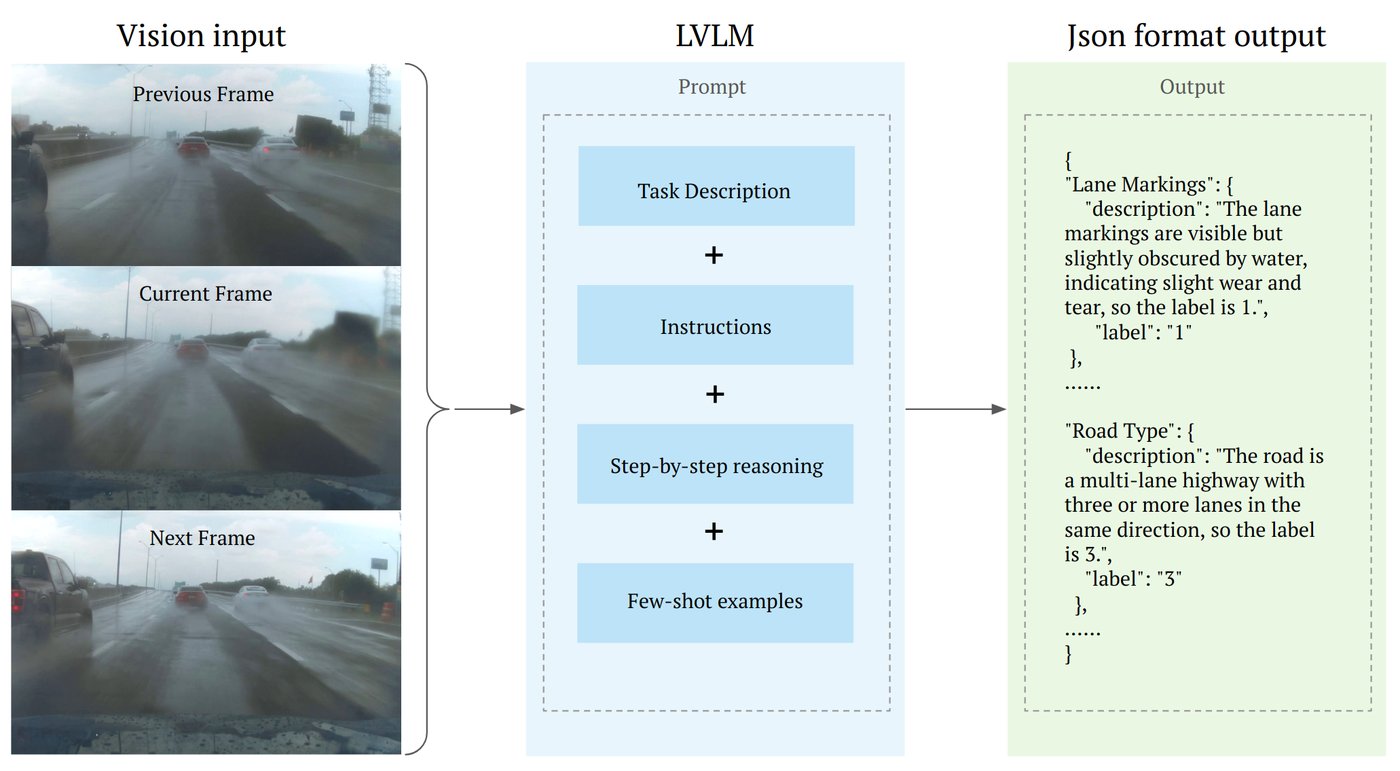
| Scene labels | Ten categories (weather, light, marking quality, construction, curves and more) from a vision-language model, checked against 2,000+ hand labels. |
Hours of driving in public datasets. OpenLKA is the only one that pairs video with decoded vehicle signals and scene labels for lane keeping.
| Dataset | Hours | LKA focus |
|---|---|---|
| OpenLKA | 389 | video + vehicle signals + scene labels |
| nuScenes, BDD100K | about 1,200 | no |
| Waymo Open | 570+ | no |
| HDD | 104 | no |
| BDD-X | 77 | no |
| comma2k19 | 33 | no |
| KITTI | 1.5 | no |
Why it matters for your DoT. 83% of the hours were recorded on Florida roads, so the statistics describe one state's markings, weather and traffic in depth. Community drives from 30+ states and provinces show how the same systems behave elsewhere.
One Tampa campaign grew into an open dataset, peer-reviewed papers and a family of six sibling datasets built on the same recording method.
16,446 takeover-centered clips from 364 drivers. The fleet clips on this page come from it.
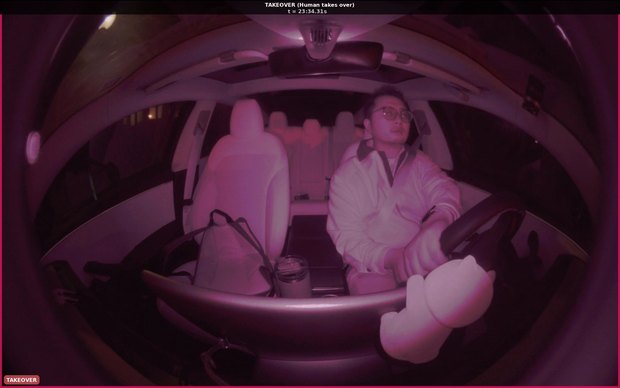
136.6 h of bidirectional human and automation control transitions with video, CAN, radar and GPS.
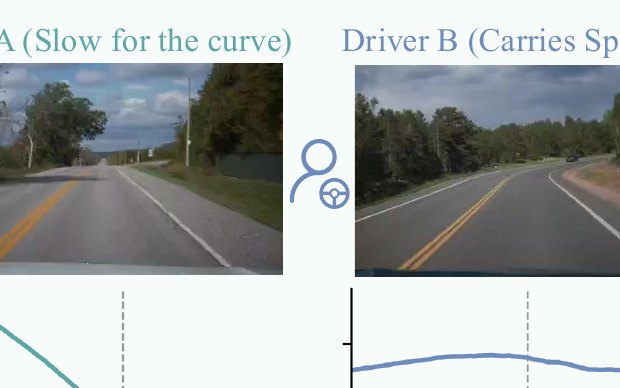
Driving-style identification: 4,121 drives from 465 drivers, 975 h.
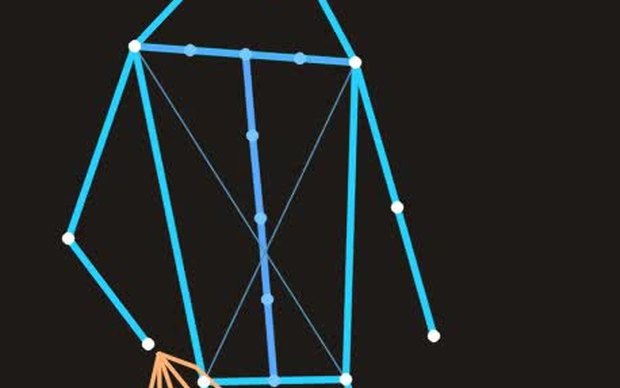
400 h of privacy-reduced in-cabin body motion for driver-motion forecasting.
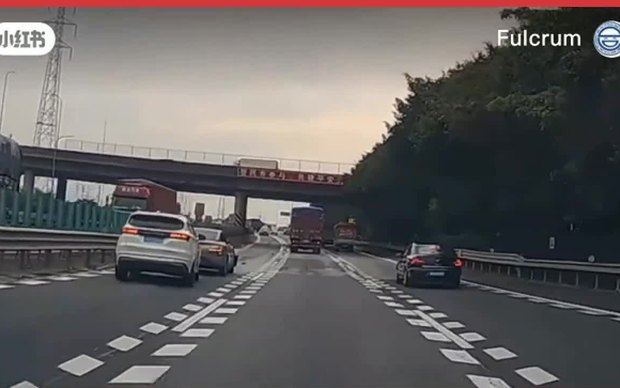
Observe before you alert: a vision-language framework for adaptive driver alerting, with a 192,892-tick benchmark.
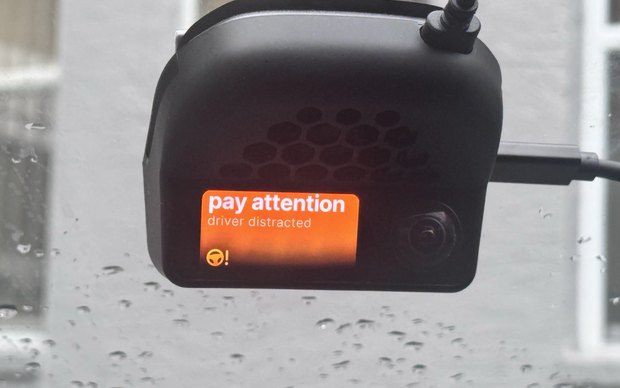
A world model that forecasts driver, vehicle and road demands in real time on a dash-mounted device.
Why it matters for your DoT. The team has run this recording method for two years on Tampa Bay roads. The pipeline, the people and the fleet are in place, and the method travels: a recorder, a rental car and a corridor.
Samples are open now. The full decoded dataset is shared on request, so we know who is using it and can point you to the right subset.
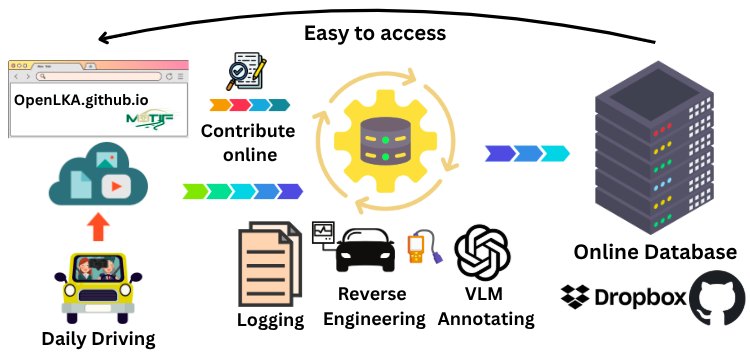
Normal, Failure and Alert pre-release folders on Dropbox; code, DBC files and download.sh --partial on GitHub.
Decoded per-route CSVs (100 Hz where the full route log exists, 10 Hz otherwise) with synchronized 526 × 330 video for all 389 h. Request, review, then a Google Drive or Dropbox link by email.
Raw rlog and qcamera files, plus HD and fisheye video for the lab fleet. Requires a signed research agreement between institutions.
We review requests within 5 business days and reply from yuhangw@usf.edu with a download link or questions. Tell us who you are, your affiliation, what you intend to do with the data and which subset you need.
Email a requestRequest form: coming soon, use email. Last release: pre-release folders (Normal / Failure / Alert) on Dropbox.
One row per 0.01 s (0.1 s for routes that only have the 10 Hz log): the car's own lane-keeping and cruise state, steering angle and torque, speed, acceleration, pedals, the lane model's lane-line positions and confidences, GPS and wall-clock time. See the glossary in the CAN lab section.
Yes. Name it in your request; we can cut by make, recorder ID, date or route.
To know who uses the data, to keep raw video under the terms above, and to point you to the subset that fits your question.
A versioned snapshot will be archived with a DOI alongside the journal publication.
Why it matters for your DoT. An engineer can start with the open samples today and request the decoded routes for the corridors they manage.
Code and DBC files are MIT-licensed; the data is shared under the OpenLKA terms above. For state DoTs and road owners: we can run the same method on your corridors.
@inproceedings{wang2025openlka,
  title     = {OpenLKA: An Open Dataset of Lane Keeping Assist from Production Vehicles Under Real-World Driving Conditions},
  author    = {Wang, Yuhang and Alhuraish, Abdulaziz and Yuan, Shengming and Zhou, Hao},
  booktitle = {IEEE International Conference on Intelligent Transportation Systems (ITSC)},
  year      = {2025}
}